Monitoring Irradiance using an STS-UV-RAD Spectrometer
A hundred years is a long time to wait for the chance to see a total solar eclipse. On August 21, 2017, with a rare eclipse tracing a path across the U.S. from west to east, we finally had our chance.
Even if you weren’t in the 60-70-mile “path of totality,” you could travel to the closest region of totality or experience partial eclipses from 75%-90% coverage (Figure 1). More than 300 million people in North America had a chance to view the eclipse according to NASA. The continent was gripped with eclipse mania in anticipation of such an epic, once-in-a-lifetime event.
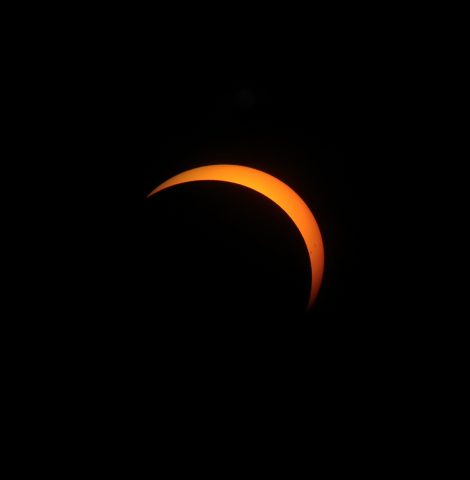
Figure 1. The solar eclipse as viewed from Cincinnati, Ohio. Photo: Jeremy Sharp
Observing the 2017 Solar Eclipse
With such a narrow swath in the eclipse’s path of totality, many did not experience blackening skies or a landscape eerily plunged into darkness. Like most summer days where we are, the August 21 sky was bright and everything appeared as usual even though an amazing event was occurring in the skies above.
On that day, we were fortunate enough to experience a total or near total solar eclipse. The excitement was everywhere. The eclipse was all anyone could talk about. Eclipse viewers all over North America knew what percentage coverage they would have (Figure 2). Everyone was working out their plan for a safe way to catch a glimpse of the eclipse.
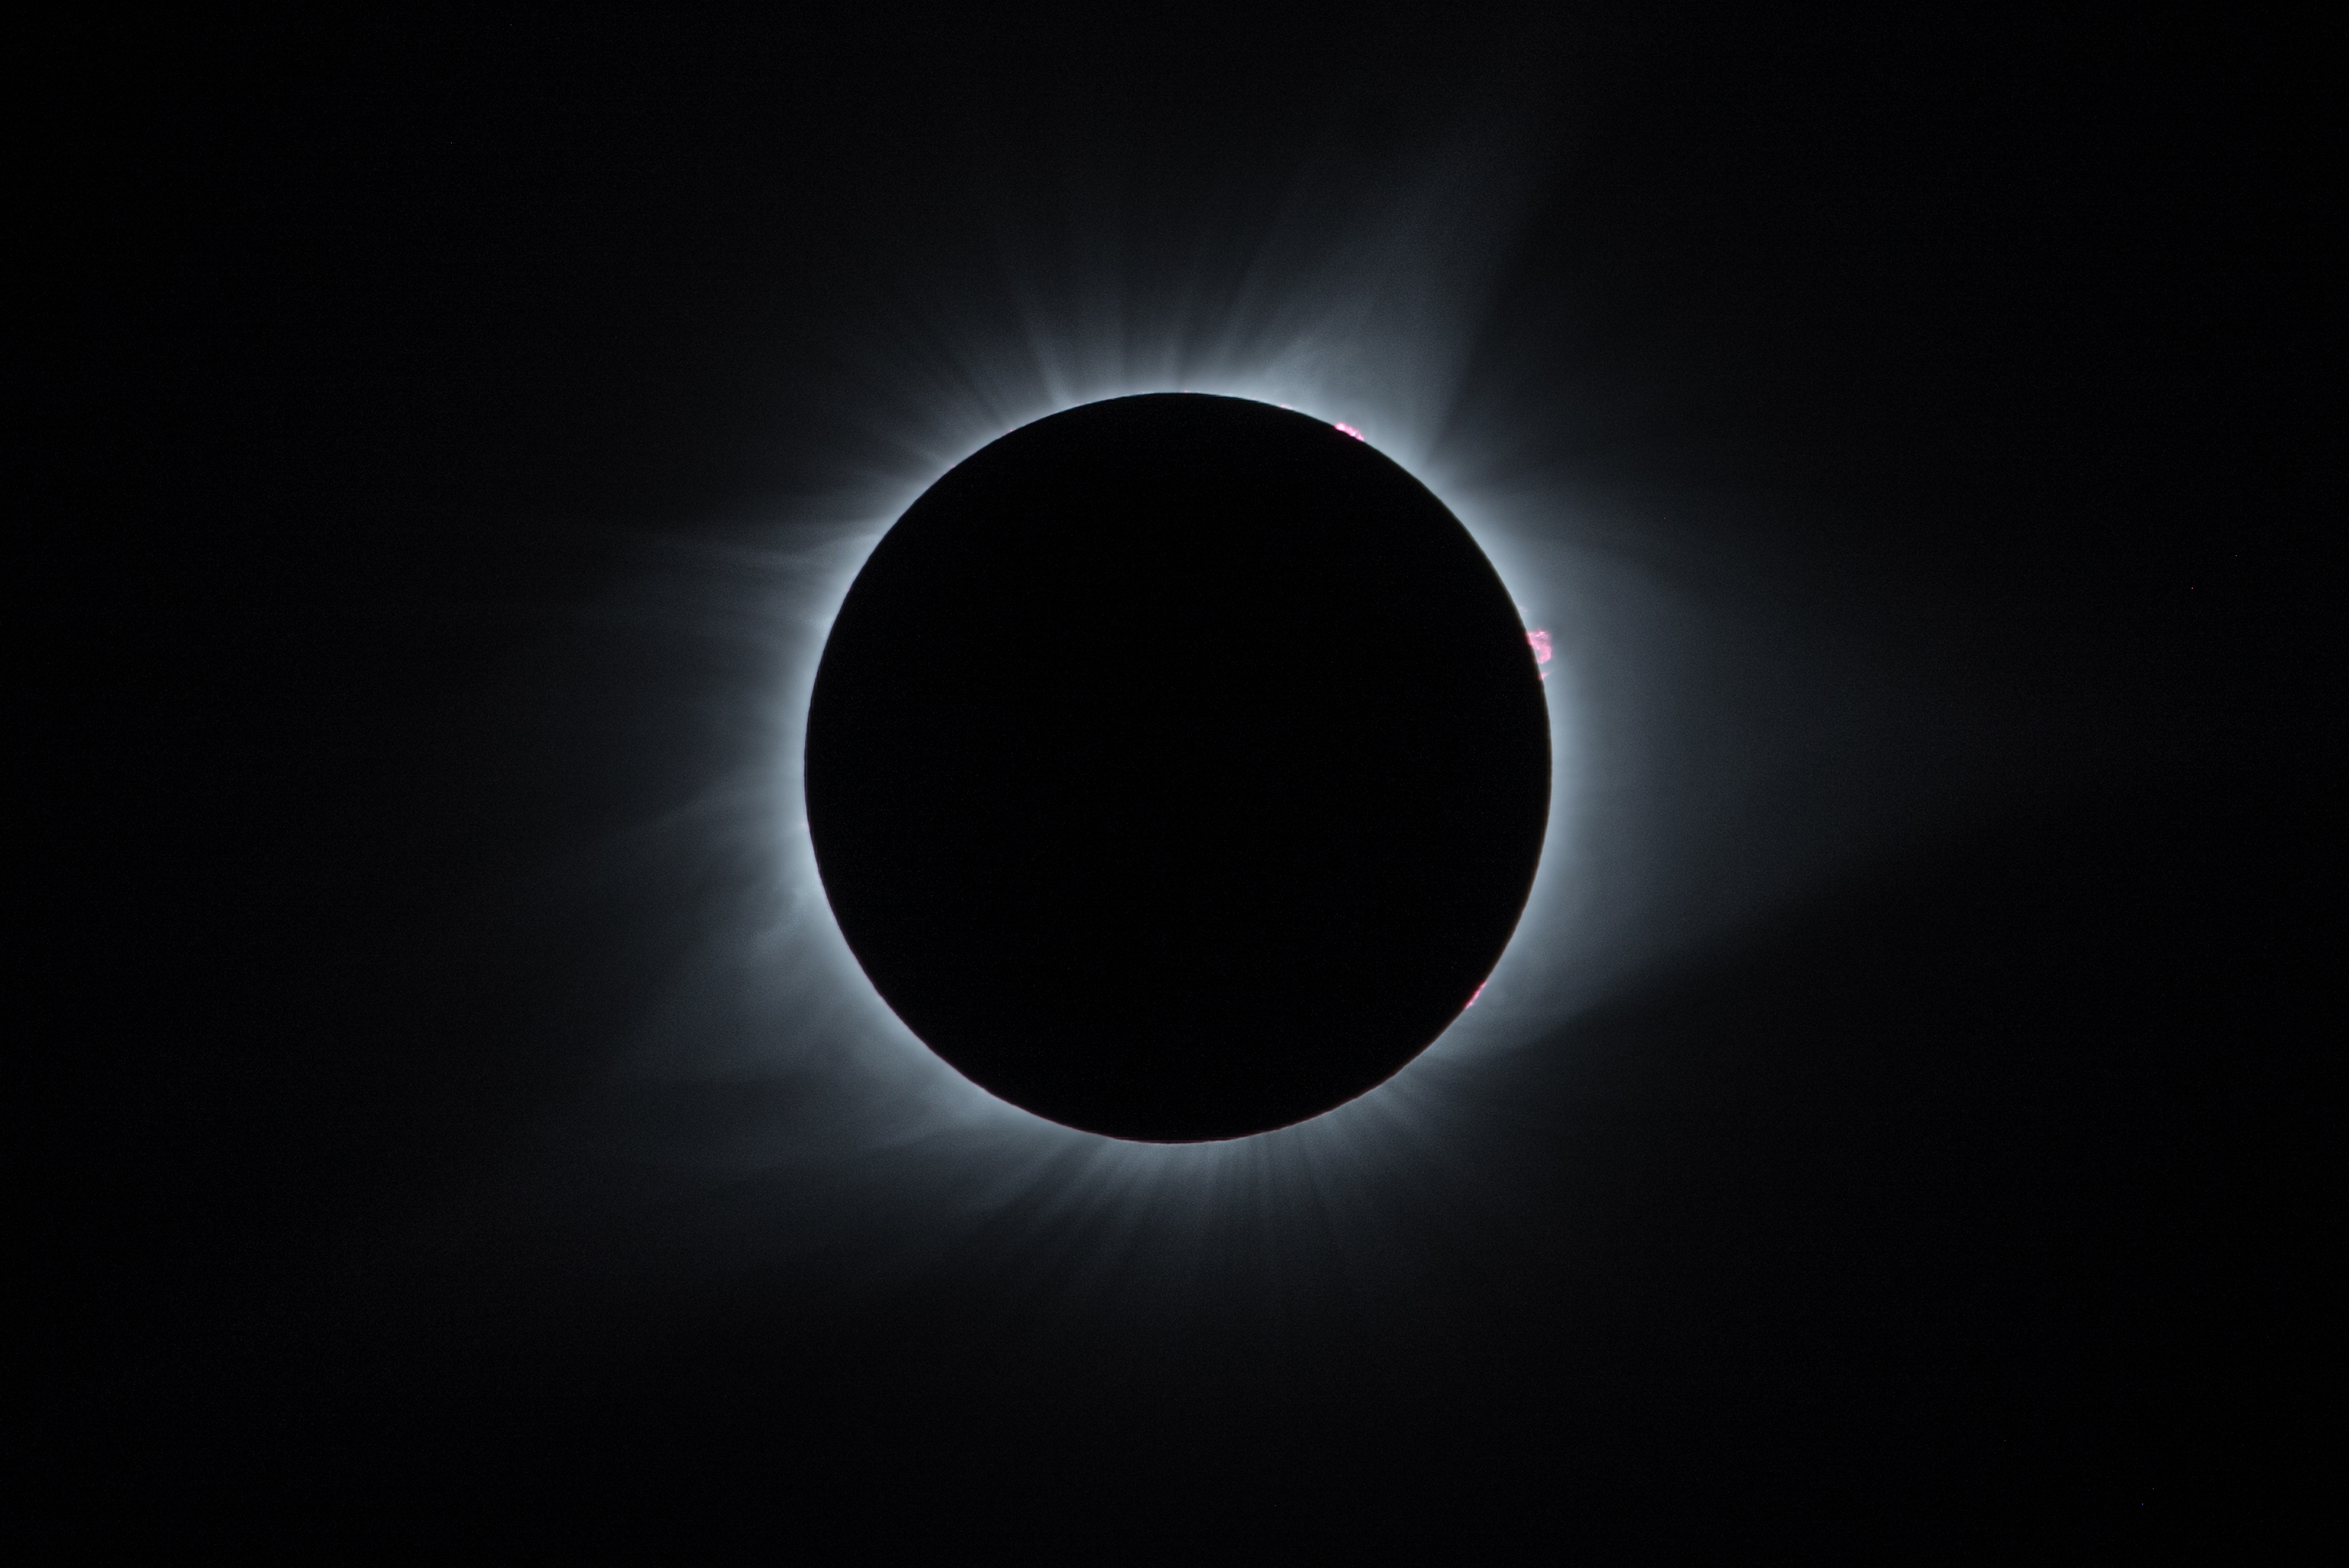
Figure 2. The solar eclipse as viewed from Greenville, S.C. Photo: Rick Gottlieb
For anyone wanting to view the eclipse directly, eclipse viewing glasses were a must-have item. Not only did they protect the eyes from the power of the sun’s rays but they were essential if you wanted to see the moon crossing the sun. The sun shined brightly in the regions of partial coverage, so brightly that you wouldn’t have known that an eclipse was occurring unless you turned your eyes toward the sky wearing your eclipse glasses.
For direct viewing, eclipse glasses compliant with ISO 12312-2 were very popular and many retailers sold out of them ahead of the eclipse. Instructions for creating pinhole cameras and other devices for indirect viewing of the eclipse were abundant across the Internet. We even had several clever Ocean Optics users and colleagues who “viewed” the eclipse safely using their spectrometers. They protected their eyes while capturing detailed spectral data using compact spectrometers designed for measurements anywhere.
Irradiance Measurements of the Solar Eclipse
One of our distributor colleagues, Russ Gill from Gamble Technologies in Canada, held a spectroscopy eclipse viewing party in his backyard in Brampton, Ontario, using an STS-UV-RAD spectrometer with a direct-attach cosine correct to acquire irradiance data from 200-650 nm throughout the eclipse (Figure 3).
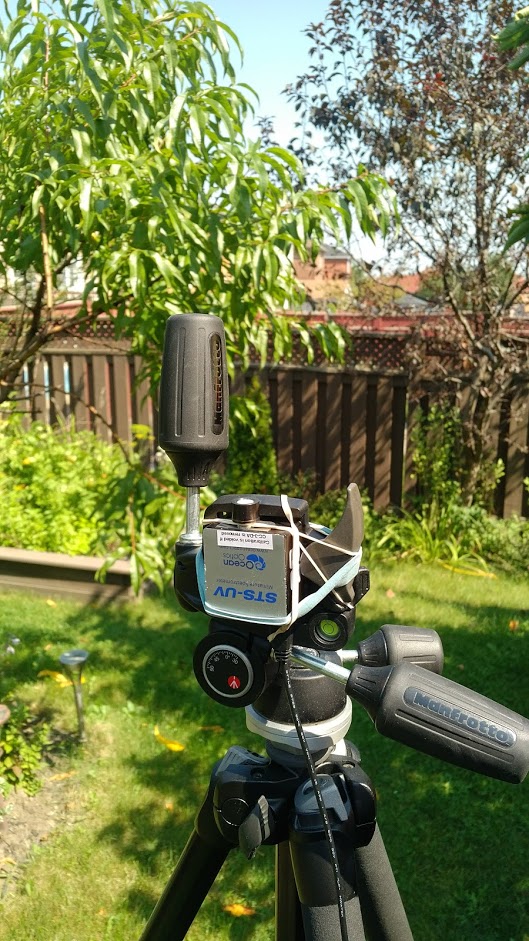
Figure 3. Irradiance measurements were performed using an STS-UV-RAD spectrometer mounted to a tripod, with a direct-attach cosine corrector to collect signal from 180° FOV. Photo: Russ Gill
Eclipse viewers in Brampton witnessed a partial eclipse with about 80% totality. The onset of the eclipse was at 1:09 p.m. (EDT) with maximum coverage occurring at 2:31 p.m. (EDT). The STS-UV-RAD was oriented facing straight overhead as shown in Figure 3. The sun moved in an arc around the spectrometer. The day was mostly sunny with some clouds passing over the setup during the eclipse. The STS-UV-RAD was equipped with a direct-attach cosine corrector that collected light with a 180° field of view. Irradiance spectra are shown in Figure 4.
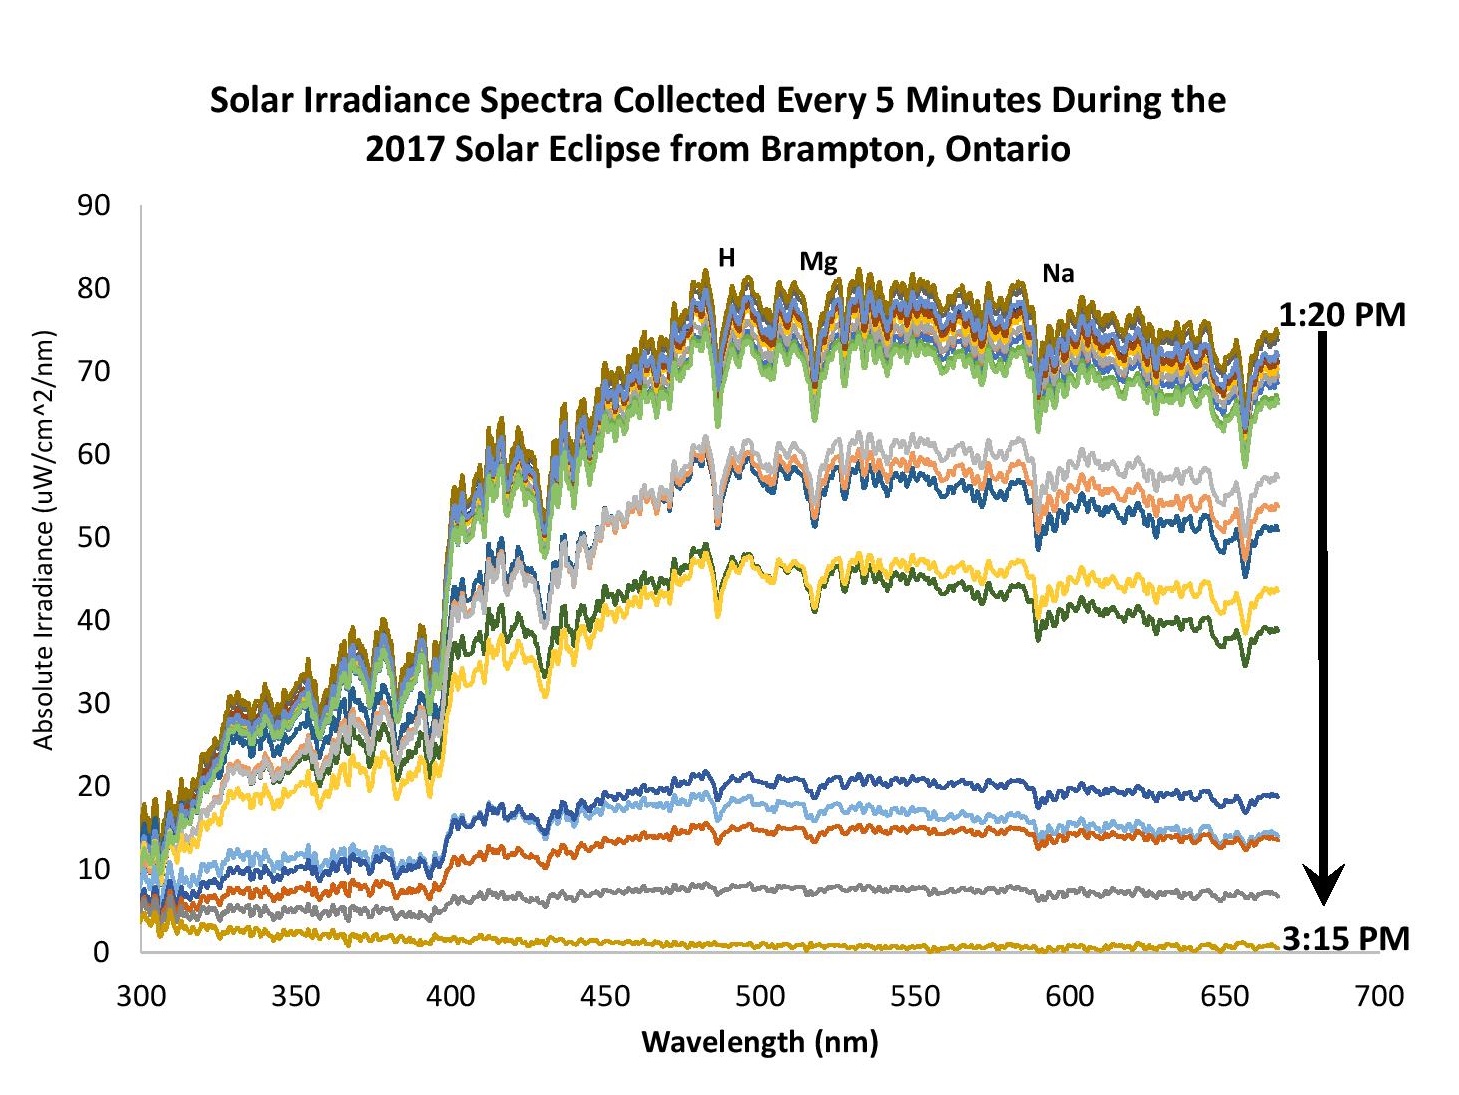
Figure 4. Solar irradiance spectra were captured during the eclipse.
The shape of the irradiance spectra and the presence of solar lines are consistent with other solar spectra (see Figure 5).
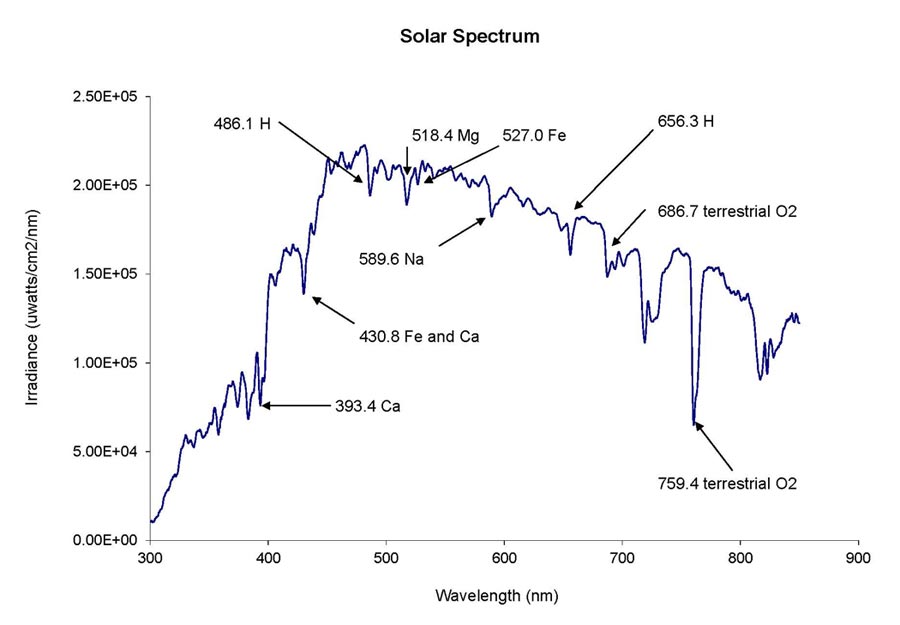
Figure 5. Pre-eclipse solar spectra were captured using a USB2000+ spectra with cosine corrector.
The trend in irradiance for solar lines arising from absorbance by hydrogen (H) at 486.1 nm, magnesium (Mg) at 518.4 nm and sodium (Na) at 589.6 nm is shown in Figure 6. The trend for these lines showed the decrease in irradiance as the moon passed in front of the sun, with two dips in intensity attributed to clouds passing overhead. Even though the decrease in irradiance was not visible to the naked eye (the skies did not darken during the eclipse), the spectrometer captured the eclipse in detail.
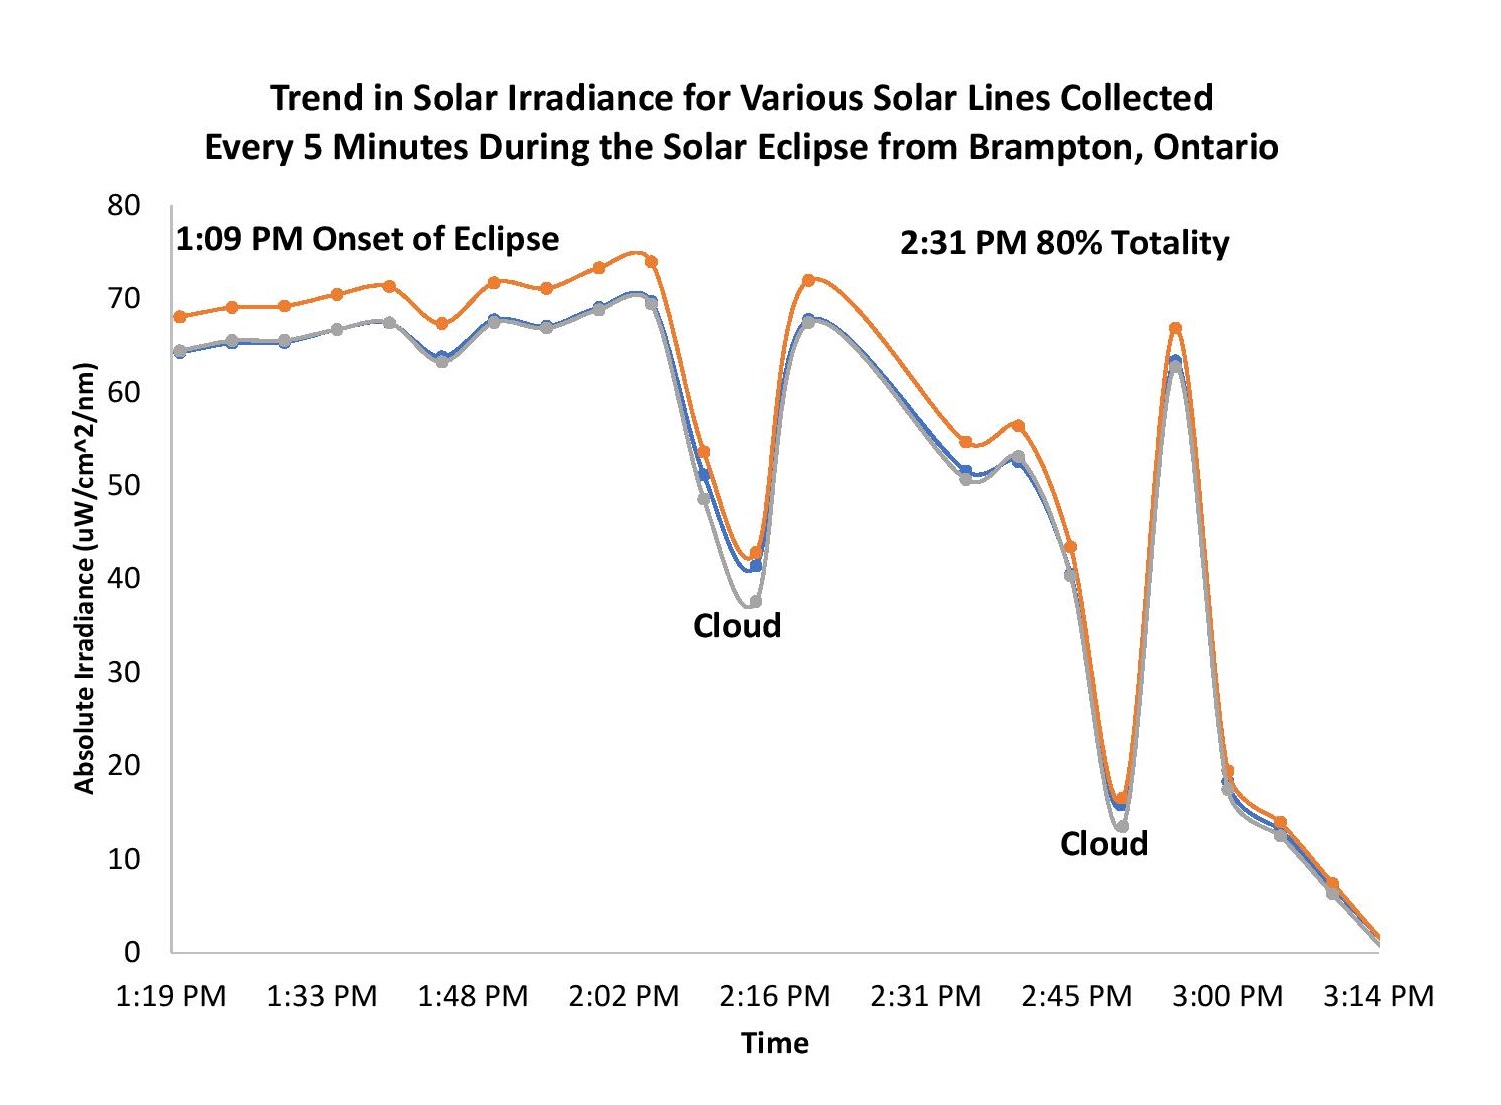
Figure 6. Despite sunny skies overhead, spectral data showed that solar irradiance decreased as the moon passed in front of the sun.
The total solar eclipse of 2017 has come and gone but the excitement remains in the amazing images and data acquired during this event, which was viewed by several hundred million people across North America. Fortunately, we won’t have to wait another 100 years for the next one. The next North American total solar eclipse will happen in 2024.
Wherever you are for the next major eclipse, don’t forget to pack your Ocean Optics spectrometer to capture a very detailed view of the eclipse not available with special glasses or pinhole viewers.


")


