How to Ensure Reliable Absorbance Results
Cuvette-based absorbance measurements are only as good as the system used for the measurements. Baseline drift and other spectral changes attributed to varying ambient conditions are easily addressed by taking frequent background and reference measurements. Cuvette-to-cuvette variability is overcome using matched cuvettes. Acquisition parameters are set to provide the highest possible signal to noise ratio. So why does your baseline drop below zero when you switch out samples? Why are your absorbance values negative? Why is your standard curve so poorly correlated? The answers lie in a component of your system you probably don’t even think about – your cuvette holder. Accurate absorbance data requires a well-engineered cuvette holder that enables users to remove and replace cuvettes repeatably (Figure 1). Even the most expensive, matched set of quartz cuvettes will not provide accurate data if the cuvettes are not placed consistently in the cuvette holder. Cuvettes should fit snugly in the cuvette holder, so they can be removed and replaced without causing a change in the spectral data. Baselines that shift below zero and negative absorbance values are immediate warning signs of problems. These issues call the data into question and degrade confidence in the results. How can you trust any of the data you just collected when these events happen?
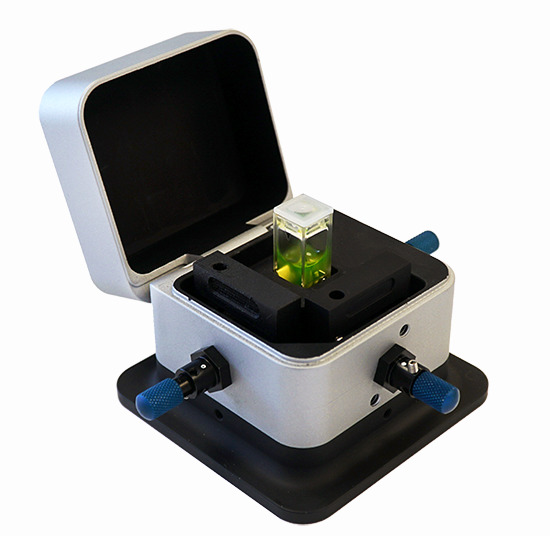
Figure 1. Even when best practices are observed, less than ideal equipment can affect experiment results.
The SQUARE ONE cuvette holder minimizes errors in absorbance measurements than can result from poorly fitted cuvettes.
Repeatability with the SQUARE ONE Cuvette Holder
You worked hard to create your samples and design your experiment. Don’t waste all that valuable time and effort on a cuvette holder that undermines your ability to make consistent, repeatable measurements. The results from even the most precisely prepared samples are only as accurate as the system used to measure them. Don’t let the cuvette holder sabotage your work. Use the Square One cuvette holder because great data starts with Square One. Sometimes, cuvette holders simply don’t “feel” right. Have you ever placed your cuvette into the cuvette holder and questioned the wobbly fit of your cuvette? How repeatable is the spectral data when the cuvette isn’t held securely? Does your standard curve look as inaccurate as the curve in Figure 2?
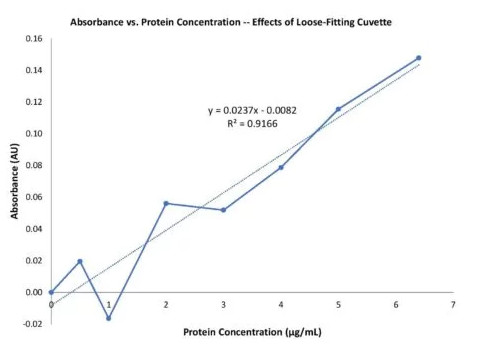
Figure 2. Example of a standard curve with poor correlation between the actual concentration and absorbance values. Are these differences in absorbance due to protein concentration, errors in sample preparation or issues with the lack of repeatability in cuvette placement in the cuvette holder?
With SQUARE ONE, cuvettes are held snugly without damaging the delicate cuvette optical surfaces. Inserting the cuvette into the cuvette holder provides the user with tactile feedback that the cuvette is held securely. SQUARE ONE provides repeatable data with both quartz (Figure 3) and plastic disposable cuvettes (Figure 4). To test this, we performed absorbance by removing and replacing the cuvette in the cuvette holder 10 times. As demonstrated in Figures 3-4, the resulting spectra overlay with stunning agreement, regardless of whether quartz or less repeatable disposable cuvettes are used.
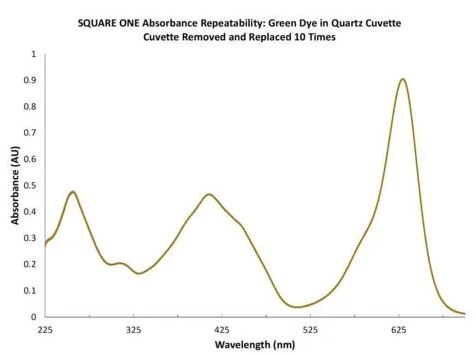
Figure 3. SQUARE ONE spectral repeatability when a quartz cuvette (item CV-Q-10) containing diluted green food dye is removed and replaced in the cuvette holder 10 times. The spectra overlay almost perfectly -- with amazing agreement among the spectra -- with an average absorbance of 0.47 AU at 410 nm with standard deviation of just 0.0007 AU.
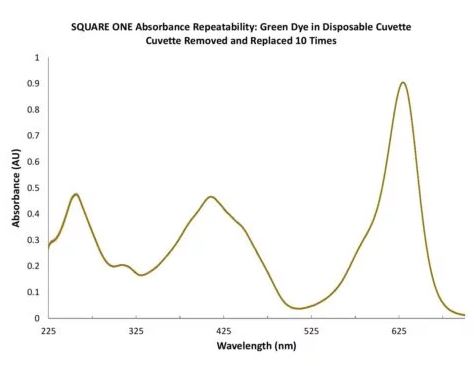
Figure 4. SQUARE ONE spectral repeatability when a disposable cuvette containing a slightly more concentrated green food dye is removed and replaced in the cuvette holder 10 times. Even with disposable cuvettes (item CVD-UV-1S), the spectra overlay almost perfectly, with an average absorbance of 0.47 AU at 410 nm with standard deviation of just 0.0008 AU.
About the SQUARE ONE Cuvette Holder
The SQUARE ONE cuvette holder is designed to hold 1 cm pathlength cuvettes securely for performing absorbance, transmission and fluorescence measurements. Included with each holder are three collimating lenses with fiber optic couplings, an integrated mirror to improve sensitivity of fluorescence measurements, a fully integrated cover to block ambient light and two filter holders that accept both 12.5 and 25 mm diameter filters. When used with Ocean Optics spectrometers and light sources, SQUARE ONE is ideal to measure absorbance, transmission, fluorescence, scattering or any combination of these optical phenomena.
Additional Absorbance Measurement Tips
With optimized spectral equipment in place including the SQUARE ONE cuvette holder, you can turn your focus to other aspects of your measurements to further improve accuracy. Here are some additional best practices we recommend for the highest quality absorbance data:
- Absorbance may vary from cuvette to cuvette. It will also vary with the orientation of the cuvette in the sample holder if the cuvette does not have the same pathlength in all directions. For best accuracy, always use the same cuvette. If this isn’t feasible, make sure cuvettes are oriented the same way every time they are placed in the cuvette holder.
- Warm up the light source for the recommended amount of time (up to 30 minutes in some cases). Light source output will continue to change very slightly until the source is in thermal equilibrium, affecting measurements.
- Record frequent dark and reference measurements in software to reestablish an accurate baseline.
Never turn off the light source or disconnect fibers to take a dark measurement. Instead, block the light source at its origin, or at the filter slot in the cuvette holder. Make sure the object used will block 100% of the light; metal works well.
- Set the spectrometer integration time so that the reference spectrum peaks at 80% to 90% of the full scale of counts. This takes advantage of the full dynamic range of the spectrometer, improving signal-to-noise performance.
- Set spectral averages as high as tolerable to improve signal-to-noise (S:N). S:N improves with the square root of the number of averages taken. For example, setting averages to 9 improves the S:N by a factor of 3.
- Increasing the boxcar value also can smooth out noise in the spectrum. This is a moving average with wavelength, so a boxcar value of 2 will average an additional 2 pixels on each side (5 in total) and assign that average to the center pixel. If the boxcar value is set too high, it will begin to blur the spectral shape, so use this feature carefully. To smooth data without affecting resolution, set the boxcar value equal to the pixel resolution of your spectrometer.


")


